The Protection of Plant Varieties and Farmers' Rights Act (PPVFRA), 2001, allocates intellectual property rights over plant varieties among public and private breeders and farmers and is among the few laws anywhere to recognise farmers as breeders in their own right. This paper examines the 10,462 certificates issued under the Act between 2009 and 2025. Farmers hold half of all certificates, but 5233 of their 5238 fall in the single category of farmers' varieties and only one new variety has been registered to a farmer in seventeen years. Private firms hold 85.4 per cent of new varieties, distributed across 133 named applicants, with one firm holding 22.2 per cent. Resolved to control company ownership, the register contains 103 groups and the five largest hold 56.1 per cent of all certificates issued to the private sector. The steep rise in issuance since 2023 is largely the clearance of a backlog, with threequarters of the certificates issued in 2023-2025 filed in 2019 or earlier. Private participation is heaviest where seed must be repurchased each season, in hybrid cotton and vegetables and minimal in legumes, fruits and spices. The finding that farmers hold half the register's certificates rests disproportionately on rice. Excluding it, private firms become the largest category. The Act's redistributive mechanisms have not operated satisfactorily either- the National Gene Fund has disbursed nothing beyond administrative expenditure in any year since 2012-13.
1. Introduction
Who owns a crop variety and what does owning it entitle the owner to? For most of India's post-independence developmental history, these questions did not arise in law. Seed was developed by public institutions, distributed through State agencies and saved and exchanged by cultivators without restriction. That position changed over the past three decades, as ownership of plant varieties was brought within intellectual property law, first through the liberalisation of the seed sector in 1988 and then through the Protection of Plant Varieties and Farmers' Rights Act (PPVFRA), 2001.
PPVFRA was enacted in fulfilment of India's obligations under the World Trade Organisation's Agreement on Trade-Related Aspects of Intellectual Property Rights (TRIPS). Article 27.3(b) required members to protect plant varieties through patents or an effective sui generis system. India adopted the second option, consistent with Section 3(j) of its Patents Act, 1970. It excludes plants and essentially biological processes from patentability, while also permitting the legislature to address concerns of food security and farmers' livelihoods that a patent regime might not accommodate. As one of the only operating alternatives to the UPOV model, it is the law that other developing countries examining their TRIPS obligations most often look to.
India's statute is one of some ambition. It recognises three classes of right-holders, viz. breeders, researchers and farmers. Farmers are acknowledged not only as cultivators and conservers of plant genetic resources but as breeders, a recognition with few parallels elsewhere. The Act established the National Gene Fund for benefit-sharing payments to farming communities, provided for compulsory licensing where seed of a protected variety is not reasonably available and exempted farmers from fees pertaining to registration of varieties. It sought to distribute rights across the public research system, the private seed industry and cultivators themselves.
This paper asks what that distribution has looked like in practice over the years. The certification record maintained by the Protection of Plant Varieties and Farmers' Rights Authority offers a means of answering. Seventeen years after the first certificate was issued, the register holds enough entries to establish who has secured more (or less) rights and control over India's plant varieties, in which categories and in which crops. The paper examines the 10,462 certificates issued between 2009 and 2025 in three stages: (1) the aggregate distribution of rights held across private, public and farmer applicants; (2) the character of private participation, including concentration among firms, its movement over time and its measurement once the register is resolved to controlling ownership; and (3) variation across crop groups and crops.
The evidence indicates that the Act has delivered inclusion in form for farmers, but with some important qualifiers. Farmers hold a substantial share of the register, but almost entirely in a single category and a single crop. The categories that carry commercial rights are dominated by private firms in crops with established seed markets and are concentrated within a small number of corporate groups.
2. Research Questions
This paper addresses three questions:
- What does the distribution of certificates among stakeholders show about India's formal seed innovation system under the PPVFRA?
- Do private entities dominate plant variety certification and if so, what is the nature and measured extent of that dominance?
- How do certification and the balance between private, public and farmer contributions vary across major crops and crop groups?
3. Review of Literature
3.1 The international framework
Three international instruments primarily shaped the terms on which India legislated. The International Union for the Protection of New Varieties of Plants (UPOV), established in 1961, set the template for plant breeders' rights in industrialised countries and its 1991 revision substantially strengthened those rights by restricting farm-saved seed and extending protection to essentially derived varieties (Dhar, 2002). The Convention on Biological Diversity (1992) and the International Treaty on Plant Genetic Resources for Food and Agriculture (2001) established the competing principles of national sovereignty and farmers' rights, from which the Indian Act draws much of its language.
TRIPS obliged members to protect IPRSs over plant varieties but left the form open. Dhar (2002) identifies three readings of the word "effective" in Article 27.3(b) as: a law that adequately enforces rights, a law that adopts the UPOV framework (the reading advanced by the UPOV and WTO secretariats) and a law that extends protection to the widest range of varieties and stakeholders. He places India in the third category and describes the PPVFRA as the only sui generis system enacted outside UPOV at the time.
3.2 The Indian legislation and its assessment
The PPVFRA converts the general principle of farmers' rights into specific provisions, including the rights to save and exchange seed, to register varieties, to benefit-sharing and to exemption from fees (Bala Ravi, 2004). Sahai (2003) reads this structure as a deliberate rejection of the UPOV model, which she considers unsuited to developing countries because it addresses breeders' interests alone. Gopalakrishnan (2002) is less sanguine, observing that a sui generis system of this kind legitimises private property in biological material while treating collective ownership as a residual category.
The Act establishes several categories of registrable varieties. New varieties must satisfy the criteria of novelty, distinctness, uniformity and stability. Extant varieties are those already in cultivation or common knowledge, in three sub-categories: varieties notified under the Seeds Act, 1966; varieties of common knowledge not formally notified; and farmers' varieties, including landraces and wild relatives traditionally cultivated and improved by farmers. Essentially derived varieties are those predominantly derived from an initial protected variety. Where such a variety derives from a farmer's variety, the Act requires the consent of the farming community and provides for benefit-sharing upon commercialisation.
Farmers' varieties are registered on the conditions of distinctness, uniformity and stability alone. They are exempt from the novelty requirement that other varieties need and the procedure is simplified under the Act. The proviso to section 18(1) relaxes most application requirements that bind other applicants and section 44 exempts farmers from fees in any proceeding before the Authority. What registration confers is the same in kind as for any other breeder. Section 28 vests the exclusive right to produce, sell, market and distribute in the breeder of a registered variety irrespective of the category under which it is registered. Section 24(6) grants fifteen years of protection to all registered varieties (Kochupillai, 2016), the only difference being that the term for varieties notified under the Seeds Act runs from the date of notification rather than from the date of registration. The proviso to section 39(1)(iv), the Act's general preservation of the farmer's right to save, use, exchange and sell seed, restricts one manner of sale only, viz., a farmer may not sell seed of a protected variety in packages labelled with its registered denomination (Bala Ravi, 2004; Sahai, 2003). The Supreme Court decision in the FL-2027 potato matter in August 2026 confirmed that a farmer sued for infringement may invoke section 39(1)(iv) as defence.
Two prior analyses of the register itself frame the present study. Lushington (2012) examined applications filed from 2007 to 2011-12, during which 226 applications for farmers' varieties were filed and 3 were granted. She found that registered farmers had received no pecuniary benefit, that most of their varieties predated plant variety protection by decades and that registration depended on facilitating organisations, among them the National Innovation Foundation, the M. S. Swaminathan Research Foundation, State Agricultural Universities and, in Odisha, the State Department of Agriculture, which accounted for the largest single share of applications. Kochupillai (2016) analysed the 4937 applications filed until October 2013, distinguishing between individual and organisational applicants within the farmer category and found that 1501 of 1579 farmers' variety applications were for rice. Both studies analysed applications, probably as only 695 certificates had been granted by late 2013. Singh and Agrawal (2019), the latter who was then the Registrar General of the Authority, tabulated both applications and grants to mid-2018 but did not connect them explicitly. The present paper analyses granted certificates alongwith their filing dates and is therefore the first to examine the flow between application and grant under the PPVFRA.
3.3 Changing structure of the Indian seed sector
The PPVFRA entered a seed economy already changing under liberalisation. The formal sector, from the establishment of the National Seeds Corporation in 1963, remained predominantly public until the New Policy on Seed Development, 1988 opened it to imports and to domestic and multinational private investment. Private research expanded thereafter in crops where hybrid seed was commercially viable, beginning with sorghum and pearl millet in the mid-1980s and maize in the early 1990s (Pray & Ramaswami, 2001) and extending to cotton in the 2000s.
Section 3(j) of the Patents Act bars patents on plants, so rights over varieties run through the PPVFRA while rights over inserted genes (as in genetic techniques including genetic modification and gene editing) are pursued through patents. For example, in Bt cotton, the transgenic trait was licensed to domestic seed companies through Mahyco Monsanto Biotech, a joint venture. These terms were later brought under the Cotton Seeds Price (Control) Order, 2015. A firm's certificate holdings may reflect its position as licensee of technology developed elsewhere and the register cannot distinguish this from independent research capacity. The joint venture itself, which sublicensed the trait to over forty-five companies, holds no certificate and does not appear in the register at all, as it licenses a trait and not a variety.
International evidence indicates that concentration in the ownership of plant variety rights is common where private breeding is established. Four crops accounted for 81 per cent of certificates under the United States Plant Variety Protection Act between 1971 and 1994 (Dhar, 2002) and three firms held 58 per cent of those issued between 2001 and 2021 (MacDonald et al., 2023). Howard (2015) attributes consolidation in the global seed industry to the mutually reinforcing expansion of intellectual property protection and the entry of agrochemical corporations through acquisition, with each such acquisition expanding the acquirer's germplasm and its leverage to seek further protection.
3.4 The present study
The register has grown to 10,000+ certificates since the analyses above. This paper analyses the complete record of certificates issued from inception through 2025, extends the analysis to concentration among firms across the register and its variation by crop group, resolves the register to controlling ownership and uses the filing dates recorded on certificates to arrive at grant lags for different applicant groups.
4. Methodology
4.1 Data source
The analysis uses the certification register maintained by the Protection of Plant Varieties and Farmers' Rights Authority. For every certificate, the register records a registration number, variety category, denomination, crop and crop group, applicant name and category and the dates of filing and issue. The author has aggregated and cleaned this record into an open-access dataset and dashboard (Subash, 2026).
Although the PPVFRA was enacted in 2001, the Authority began accepting applications only in 2007 and issued its first certificates in 2009. The analysis covers certificates issued from 2009 to 2025, as 2026 is a partial year. The record comprises 10,462 certificates across 120 crops in 12 crop groups, from about 3500 distinct applicants.
4.2 Categories of analysis
Two classifications carry this paper's scope of analysis. The first is the category of variety: new, extant, variety of common knowledge, extant notified, farmers' variety, or essentially derived variety. The second is the category of applicant, recorded by the Authority as private, public, farmer or individual breeder. Public applicants are further separated into State Agricultural Universities and other public institutions, principally the Indian Council of Agricultural Research and its constituent bodies.
Concentration among private applicants is reported as concentration ratios, the share of certificates held by the largest one, three, five and ten holders, supplemented by the Gini coefficient and Lorenz curve of the distribution of certificates across holders. These describe inequality in the holding of registered rights and the reader may note that they are not measures of market structure. The register records rights obtained, not seed sold or area planted. Measures and thresholds applied to sales shares in industrial economics do not carry over to a count of certificates and are not applied here.
4.4 Data preparation
Applicant names recorded on the register do not have any corporate identifiers and the same entity may appear under successive names or variant spellings. Names were first normalised for spelling and publicly documented conversions between private and public company forms, reducing the raw applicant list to the 133 private names reported in section 5.2. A second pass then identified nine cases of distinct registered names belonging to the same legal entity, each confirmed by corporate identification numbers shared between them, thereby reducing the total to 125 companies. A third pass assigned entities to groups based on the criteria of ownership, systematically established from a list of documentation- viz. the parent's statutory subsidiary schedule, an annual report, a regulatory filing, a rating agency's schedule of consolidated entities, or a court or corporate registry record. Majority ownership was treated as control and holdings consolidated in full, not apportioned by shareholding. Relationships resting only on shared promoter families or common directorships were not accepted and acquisitions of a business/product line rather than of the legal entity were not treated as changes in the holder of a certificate. The resolved groups were established individually on this evidence and the remaining applicants were then screened against them. No unresolved entity holds more than 12 certificates, against 62 for the tenth-ranked group.
Filing dates were validated against two external series. The Authority's own published counts of farmers' variety applications for 2007 to 2014 (Hanchinal et al., 2014) are consistent with the filing dates in this dataset. The Authority's published grant totals by category to June 2018 (Singh & Agrawal, 2019) fall between this dataset's end-2017 and end-2018 figures in every category.
Although the register does not publish expiry dates, they can be computed from the statutory terms under section 24(6), which is what has been done in this paper. The analysis throughout counts certificates issued rather than rights currently in force. Where it is used otherwise, the live stock figures are noted explicitly.
5. Data Analysis and Discussion
5.1 Distribution of certificates across applicant categories
Between 2009 and 2025 the Authority issued 10,462 certificates. Table 1 sets out their distribution across applicant categories, Table 2 across applicant and variety category together.
Table 1. Certificates issued under the PPVFRA by category of applicant, 2009-2025
| Category of applicant |
Certificates |
Share (per cent) |
| Farmer |
5238 |
50.1 |
| Private |
3071 |
29.4 |
| Public institutions |
1589 |
15.2 |
| State Agricultural Universities |
563 |
5.4 |
| Individual breeder |
1 |
0.0 |
| Total |
10,462 |
100.0 |
Source: Compiled from the register of the Protection of Plant Varieties and Farmers' Rights Authority.
Table 2. Certificates by category of variety and category of applicant, 2009-2025
| Category of variety |
Farmer |
Private |
Public |
SAU |
Individual |
Total |
| Farmers’ variety |
5233 |
0 |
1 |
0 |
0 |
5234 |
| New |
1 |
1556 |
232 |
31 |
1 |
1821 |
| Extant (variety of common knowledge) |
4 |
1332 |
87 |
13 |
0 |
1436 |
| Extant (notified) |
0 |
111 |
577 |
314 |
0 |
1002 |
| Extant |
0 |
58 |
692 |
205 |
0 |
955 |
| Essentially derived variety |
0 |
14 |
0 |
0 |
0 |
14 |
| Total |
5238 |
3071 |
1589 |
563 |
1 |
10,462 |
Source: Compiled from the register of the Protection of Plant Varieties and Farmers' Rights Authority.
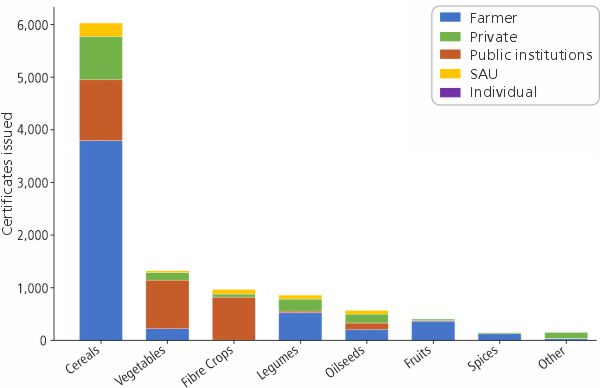
Figure 1: Cumulative certificates issued by crop group and applicant category (2009-2025)
Source: Compiled from the register of the Protection of Plant Varieties and Farmers' Rights Authority.
Farmers are the largest single category of right-holders. The variety category under which the certificates were issued provides a different account. Of the 5238 certificates held by farmers, 5233 are farmers' varieties. Only one certificate for a “new variety” has been issued to a farmer applicant in seventeen years and four for varieties of common knowledge. The distribution runs the other way in the categories carrying commercial rights. Private applicants hold 85.4 per cent of new varieties, 92.8 per cent of varieties of common knowledge and all fourteen essentially derived varieties. Public institutions and State Agricultural Universities hold 93.9 per cent of extant varieties and 88.9 per cent of extant notified varieties. The public research system holds rights largely over material already released, while private firms hold rights over varieties entering the market.
The essentially derived variety provision is worth noting for its disuse. Just fourteen certificates in seventeen years, all to private firms, have been granted to secure farmer community consent and benefit-sharing when private varieties draw on farmers' material. Lushington (2012) records officials' acknowledgement that breeders are likely to have used farmers' varieties as initial varieties without permission, a difficulty the registration figures do nothing to dispel.
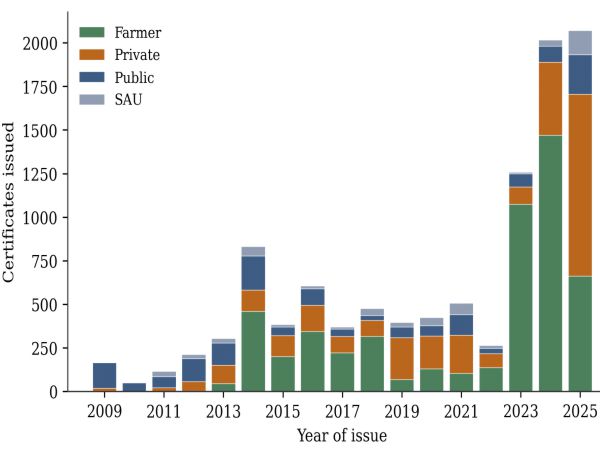
Figure 2. Certificates issued by year and applicant category, 2009-2025.
Source: Compiled from the register of the Protection of Plant Varieties and Farmers' Rights Authority.
Of the 10,462 certificates issued, 9,488, or 90.7 per cent, remain in force as of the dataset's reference date. The live share is high and roughly uniform across farmer and private applicants (99.8 and 98.5 per cent respectively), but falls to 53.3 per cent for public institutions and 68.6 per cent for State Agricultural Universities. The difference reflects the shorter statutory terms attaching to extant notified varieties, which constitute the bulk of public and SAU holdings, against the fifteen-year term that applies to new and farmers' varieties.
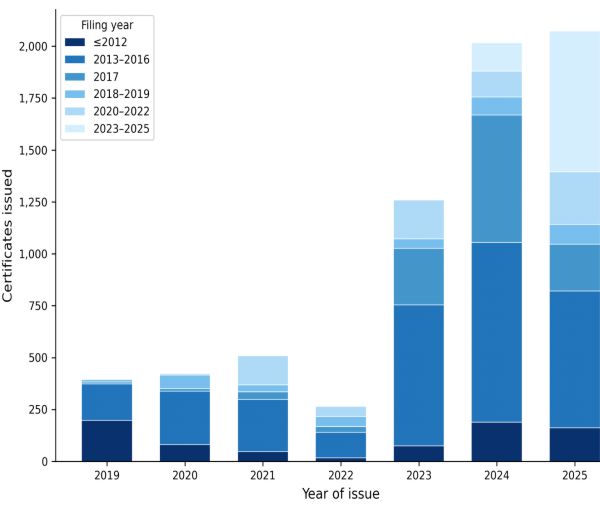
Issuance rose steeply at the end of the period (Figure 2). The three years from 2023 to 2025 account for 5349 certificates, 51.1 per cent of the seventeen-year total and private applicants received 1044 in 2025 alone, more than in the eleven years to 2019 combined. The filing dates recorded on those certificates show this to be substantially the clearance of a backlog rather than a change in application behaviour: 74.2 per cent of certificates issued in 2023-2025 were filed in 2019 or earlier, the largest contributing cohort being the 2017 filing year. The interval between filing and grant differs sharply by applicant, with a median of six years for farmers and seven for private firms, against two for public institutions and one for State Agricultural Universities.
Figure 3. Certificates issued in 2019-2025, segmented by the filing-year cohort from which the certificates originated.
Source: Compiled from the register of the Protection of Plant Varieties and Farmers' Rights Authority.
Farmer registration is episodic for a related reason. The series shows 459 certificates in 2014, a decline to 136 by 2022, then 1075 and 1470 in 2023 and 2024. These are successive cohorts of filings emerging from processing rather than successive waves of registration and the filings themselves reflect the activity of facilitating organisations rather than a steady flow of individual applications. Of 3269 farmer applicants, 84 per cent hold a single certificate, while the twenty largest hold 18.5 per cent of farmer certificates. The largest holders are registering bodies and their holdings are almost entirely in rice. Kochupillai (2016) found the same structure in applications to 2013, where organisations filed 13.9 per cent of farmers' variety applications and Hanchinal et al. (2014) attribute the 939 farmers' variety applications of 2011 to a single initiative of the Commissionerate of Agriculture in Odisha. The 2011 filing cohort in this dataset contains 809 farmer certificates, of which a majority 808 were rice.
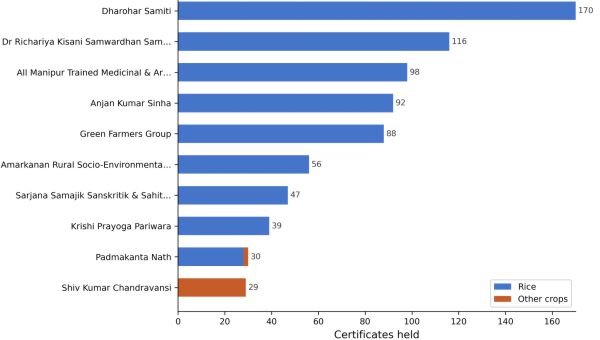
Figure 4. Leading farmer applicants by certificates held, 2009-2025.
Source: Compiled from the register of the Protection of Plant Varieties and Farmers' Rights Authority.
The largest farmer applicant, Dharohar Samiti, is a farmers' organization and holds 170 certificates, all in rice. Eight of the top ten farmer applicants are organisations rather than individual cultivators and their holdings are almost entirely in rice, as seen in Figure 4.
Cereals account for 72.4 per cent of total farmer certificates and within cereals, rice dominates. This crop alone accounts for 3326 of the 5238 certificates held by farmers, i.e; 63.5 per cent of the farmer register. No other crop reaches even 4 per cent, with pigeon pea following at 3.3 per cent, mango at 3.0 per cent and wheat at 2.0 per cent.
From literature, we find that rice's concentration is heavily attributed to the crop's biology easing varietal development. However, the institutional architecture supporting it may also play a larger role. The explanation for the former is that rice is self-pollinating, so a variety selected by a farmer becomes progressively homozygous and remains stable across generations, which bears on the ability to demonstrate the distinctness, uniformity and stability the Act requires even where novelty is waived (Salazar et al., 2007). India's traditional rice cultivation was also more diverse than that of any other staple, with over one lakh distinct landraces estimated under cultivation before the spread of high-yielding varieties (United Nations Environment Programme, 2020). Biology is necessary but not sufficient, however. Wheat is also self-pollinating and has a comparable landrace history, yet the Authority's own tabulation to 2018 records 1351 farmers' variety certificates in rice against eleven in wheat (Singh & Agrawal, 2019). What distinguishes rice is the institutional apparatus around it. The facilitating organisations and State programmes documented by Lushington (2012) and Hanchinal et al. (2014) worked almost entirely in rice landraces and the registering bodies that dominate the farmer register hold rice.
Removing rice changes both the scale and the shape of the register. The farmer share of the remaining 6326 certificates falls from 50.1 to 30.2 per cent and private applicants become the largest single category at 41.8 per cent. Removing each of the ten largest crops in turn moves no category's share by more than three percentage points- i.e; rice is the only crop whose removal reverses the picture. What remains in the farmer category disperses across pulses, minor cereals and orchard crops, with pigeon pea leading at 8.9 per cent.
5.2 The character of private participation
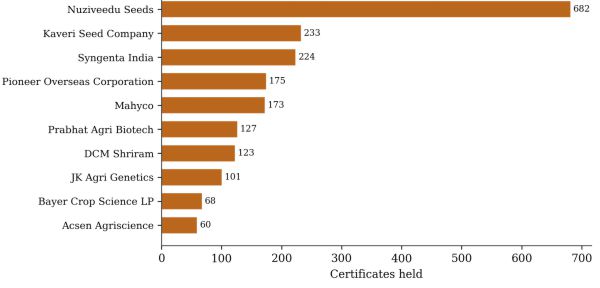
The 3071 certificates held by private applicants are distributed across 133 named firms. Figure 5 sets out the ten largest holdings.
Figure 5. Leading private applicants by certificates held, 2009-2025.
Source: Compiled from the register of the Protection of Plant Varieties and Farmers' Rights Authority.
The single largest private applicant, Nuziveedu Seeds, holds 682 certificates, close to three times the number of the firm ranked second and 22.2 per cent of all private certificates. The three largest hold 37.1 per cent, the five largest 48.4 per cent and the ten largest 64.0 per cent of all private certificates. The size distribution is also revealing: 33 firms hold a single certificate, a further 39 hold between two and five and the 23 holding more than twenty account for 81.6 per cent. So, the private sector on this register consists of a small number of firms with substantial portfolios, along with a long tail of companies with just one or two registrations each.
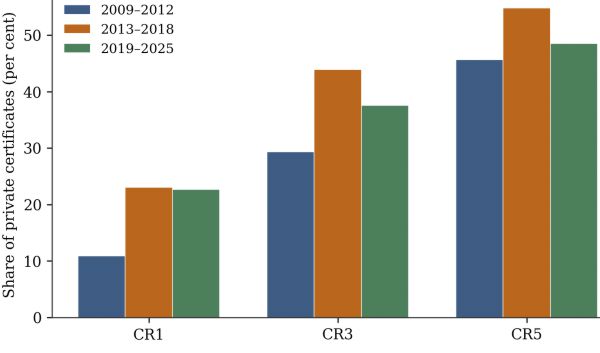
Concentration has not moved in one direction. Figure 6 reports ratios for the register's first four years when it was just taking off, the six years from 2013 to 2018 when registrations were well established and the most recent seven years to 2025, including the surge years of backlog clearance.
Figure 6. Concentration among private applicants, 2009-2025
Note: CR1, CR3 and CR5 denote the share of private certificates held by the largest one, three and five firms, respectively, in percentages. Note that figures for 2009-2012 rest on 92 certificates only.
Source: Compiled from the register of the Protection of Plant Varieties and Farmers' Rights Authority.
The share held by the five largest firms rose from 45.7 per cent in 2009-2012 to 54.8 per cent in 2013-2018 and fell to 48.5 per cent in 2019-2025, close to where it began. The number of firms obtaining certificates rose from 60 in 2013-2018 to 104 in 2019-2025.
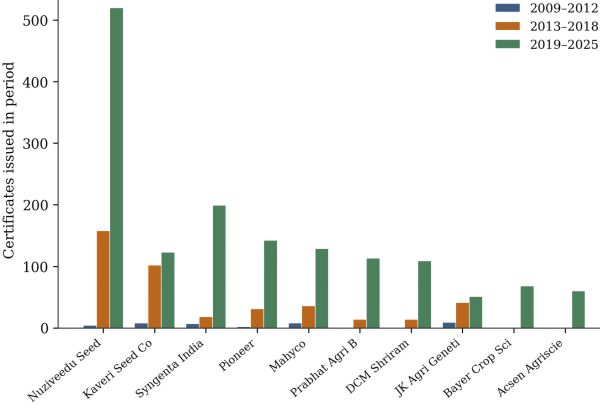
At a glance, the fall in the final period could suggest that leading firms weakened. But, Figure 7 shows that they did not. Each of the ten largest firms grew in absolute certification terms between 2013-2018 and 2019-2025. Nuziveedu from 158 to 520 certificates, Syngenta from 18 to 199 and Pioneer Overseas, Mahyco, Prabhat Agri Biotech and DCM Shriram each from a smaller base to over 100. Two of the ten, Bayer Crop Science and Acsen Agriscience, received all their certificates in this most recent period.
Figure 7. Certificates held by the ten leading private applicants
Source: Compiled from the register of the Protection of Plant Varieties and Farmers' Rights Authority.
Sixty-nine firms obtained a certificate in 2019-2025, having obtained none before and together they hold 649 certificates, 28.3 per cent of the period's total. Fourteen hold more than ten each, among them Bayer Crop Science with 68, Acsen Agriscience with 60, Beejsheetal Research with 57 and Pravardhan Seeds with 55. They are not, for the most part, new entrants. Thirty-nine of the sixty-nine had filed applications before 2019 and hold 554 of the 649 certificates (85 per cent). For example, Acsen first filed in 2013 and Beejsheetal in 2011. What the period ratios record seemingly as new entry is in substantial part the delayed grant of applications long pending and the widening base of certificate-holders reflects the Authority's rate of disposal as much as any change in the composition of the industry.
Nuziveedu Seeds has led the private sector in every period, and its position should be read against the structure of the cotton seed market which dominates its business. The firm was among those sub-licensed from 2004 to use the Bt cotton technology held by Mahyco Monsanto Biotech and its varietal portfolio is built on licensed transgenic material.
5.3 Ownership and the measurement of concentration
The figures above count applicant names as recorded. The register records neither corporate identification numbers nor parent companies and a name-level count treats as separate firms both a company recorded under successive names and distinct companies under common control. Both occur and correcting for them changes the measured distribution.
Nine of the 133 private applicant names are the same legal entity under a former name, each confirmed by a shared corporate identification number (CIN). Bisco Bio Sciences and Limagrain India are one company, so are Dow AgroSciences India and Corteva Crop India, whose registry records agree on incorporation date and on authorised and paid-up capital to the rupee. Resolving these leaves 125 companies. Beyond renaming, entities under common control are recorded separately. The seven companies consolidated in the Nuziveedu group's own audited accounts appear as seven applicants and the Bayer group's Indian and foreign entities as eight. Resolving to controlling ownership leaves 103 groups. Table 3 reports concentration at all three levels.
Table 3. Concentration among private applicants at three levels of resolution, 2009-2025
| Level of resolution |
Units |
CR1 |
CR3 |
CR5 |
CR10 |
Gini |
| Applicant names as recorded |
133 |
22.2 |
37.1 |
48.4 |
64.0 |
0.791 |
| Corrected for same-entity naming |
125 |
22.2 |
37.1 |
48.5 |
64.2 |
0.788 |
| Adjusted for controlling ownership |
103 |
28.9 |
44.3 |
56.1 |
72.7 |
0.823 |
Source: Compiled from the register of the Protection of Plant Varieties and Farmers' Rights Authority; ownership details from corporate registry records, regulatory filings and rating-agency documents.
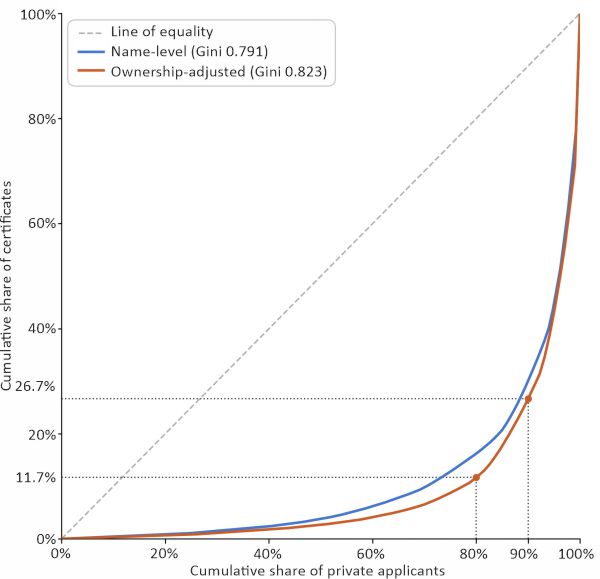
Correcting for naming leaves the ratios almost unchanged. Adjusting for ownership raises every ratio by roughly seven percentage points. The largest holder rises from 682 certificates to 888 and Bayer jumps up from ninth place with 68 to sixth with 153. The Gini coefficient falls marginally on the naming correction, which removes small duplicate units and rises to 0.823 on the ownership adjustment. The Lorenz curve in Figure 8 shows that the least-holding four fifths of groups hold 11.7 per cent of private certificates between them and the largest tenth hold 73.3 per cent.
Figure 8. Lorenz curve of certificate holdings among private applicants, name-level and ownership-adjusted
Source: Author's calculations from the register of the Protection of Plant Varieties and Farmers' Rights Authority
Two features of the exercise bear on how the register should be read. Relationships were accepted only on documentary evidence of majority control. Any relationship not established would, if confirmed, raise the measured concentration further. Second, five entities on the register are companies that no longer exist, having been amalgamated or renamed and one holds certificates for applications filed nine years before it was incorporated. The register is equally silent on transfers of business between right-holders. The cotton seed businesses of two multinational groups passed to a single domestic firm in 2018 and the rice business of another firm in 2019, by asset transfers rather than transfers of the registered entities. None is visible in the applicant field, which continues to record the firms that filed. The register, therefore, does not exactly track the corporate existence of the right-holder companies that it records.
The register also does not reliably categorise applicants, as the author found nine entities recorded as private applicants are public institutions or State bodies. Their combined holdings are small and their inclusion does not affect the reported figures significantly, but the register cannot be treated as a self-correcting record of applicant type.
5.4 Variation across crop groups
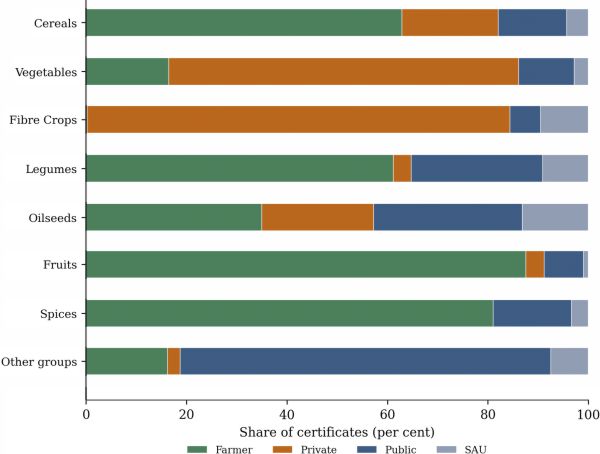
The aggregate figures conceal considerable variation between crops. Figure 9 distributes certificates across the crop groups recorded by the Authority, with the five smallest groups combined for ease of reading.
Figure 9. Distribution of certificates by crop group and category of applicant, 2009-2025.
Source: Compiled from the register of the Protection of Plant Varieties and Farmers' Rights Authority.
Private participation ranges from nil in four groups to 84.2 per cent in fibre crops. It is concentrated in three: fibre crop at 84.2 per cent, vegetables at 69.7 per cent and oilseeds at 22.3. Cereals, which account for 57.6 per cent of all certificates, record 19.2 per cent private participation. In legumes, fruits and spices, private applicants hold between nil and 3.6 per cent. Farmers hold 87.6 per cent of certificates in fruits, 81.1 per cent in spices, 62.9 per cent in cereals and 61.1 per cent in legumes.
Public institutions and State Agricultural Universities together hold 93.1 per cent in sugar crops, 77.5 per cent in tree, forest and plantation crops and 42.7 per cent in oilseeds. Three crop-group-level configurations are clearly visible. In some groups, the register is largely a record of farmers' varieties; in others, of public-sector releases; and in a third, of private registrations.
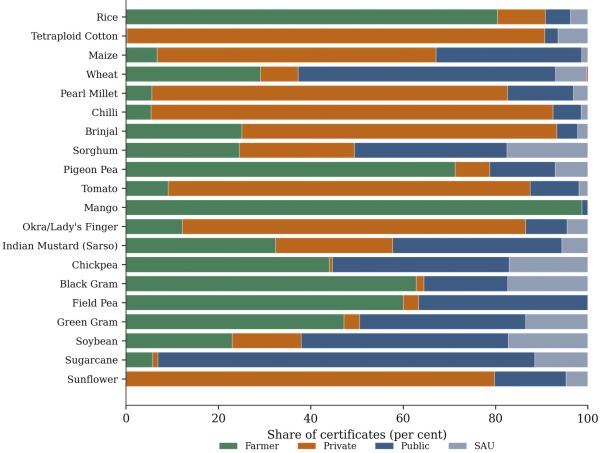
Figure 10 sets out the twenty crops with the largest number of certificates, the first ten accounting for 72.4 per cent of the register and the second ten for a further 1187 certificates, taking the twenty together to 83.8 per cent of the register.
Figure 10. Distribution of certificates for the twenty most registered crops, 2009-2025.
Source: Compiled from the register of the Protection of Plant Varieties and Farmers' Rights Authority.
Rice dominates the overall register as well, with 4136 certificates, 39.5 per cent of the register and four-fifths of them held by farmers. Cotton stands at the other end. Cotton accounts for 939 certificates, combining tetraploid (877) and diploid (62), of which 86.5 per cent are held by private firms and two by farmers. The two types sit in different positions, with tetraploid cotton at 90.4 per cent private and diploid cotton predominantly held by State Agricultural Universities at 54.8 per cent. Tetraploid cotton comprises the New World species, principally Gossypium hirsutum, grown in India almost entirely as hybrids whose seed loses vigour when re-sown and must be repurchased each season. The Bt trait approved for cultivation has been deployed in India only in tetraploid cotton and commercially almost entirely through hybrids, so the private certificates in cotton are substantially registrations of Bt hybrids built on the licensed Bt trait described in section 5.2. The diploid species, the indigenous G. arboreum and G. herbaceum, hardier and shorter-stapled, are grown as straight-line varieties whose seed farmers can save. No transgenic event has been approved in them and they remain the province of public breeding.
Wheat runs the other way again, with public institutions and State Agricultural Universities holding 62.5 per cent, the highest public share among the major crops, against 8.1 per cent private.
The crops in which private firms hold the largest shares are those with established commercial hybrid seed varieties, such as cotton, chilli, tomato, pearl millet, brinjal and maize. Those in which farmers or public institutions predominate are staples in which farm-saved seed remains widespread and public breeding has a long history, such as rice, wheat, pigeon pea and sorghum. Outside the first ten, sunflower and okra are predominantly private (nearly 80 and 74 per cent respectively), sugarcane predominantly public (over nine-tenths) and mango is 98.8 per cent farmer-held, the highest farmer share of any crop of comparable size.
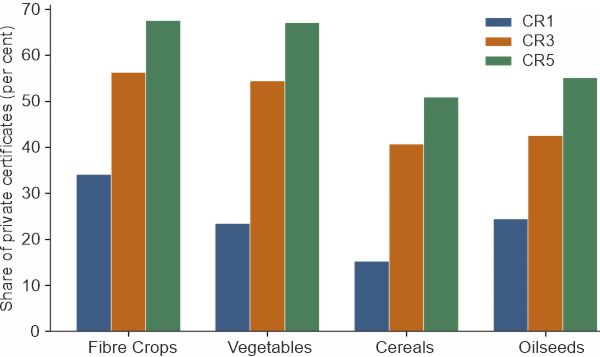
Figure 11. Concentration among private applicants by crop group, 2009-2025.
Note: CR1, CR3 and CR5 denote the share of private certificates held by the largest one, three and five firms, respectively, in per cent.
Source: Compiled from the register of the Protection of Plant Varieties and Farmers' Rights Authority.
Concentration among private firms is highest where private participation is highest. In fibre crops, the largest firm holds 34.1 per cent of private certificates and the five largest firms hold 67.5 per cent. Vegetables show 67.1 per cent for the five largest across 41 firms. Cereals, with both the largest number of private certificates and the largest number of private firms, are less concentrated at 50.9 per cent. Nuziveedu Seeds emerges as the largest private holder in cereals, vegetables and fibre crops alike.
6. Findings
6.1. On the distribution of certificates
- Farmers hold 5238 of the 10,462 certificates issued between 2009 and 2025, or 50.1 per cent, private firms 3071 (29.4 per cent) and public institutions and State Agricultural Universities 2152 (20.6 per cent).
- Of the certificates held by farmers, 5233 are farmers' varieties. One certificate for a new variety has been issued to a farmer applicant in seventeen years.
- Private applicants hold 85.4 per cent of new varieties, 92.8 per cent of varieties of common knowledge and all fourteen essentially derived varieties. Public institutions and State Agricultural Universities hold 93.9 per cent of extant varieties and 88.9 per cent of extant notified varieties.
- The essentially derived variety provision, which requires community consent when such varieties derive from farmers' varieties, has produced only 14 certificates in 17 years, all to private firms.
- Of the 10,462 certificates issued, 9,488 (90.7 per cent) remain in force. The live share is 99.8 per cent for farmers and 98.5 per cent for private firms, but only 53.3 per cent for public institutions and 68.6 per cent for State Agricultural Universities, reflecting the shorter statutory terms on the extant notified varieties they predominantly hold.
6.2. On the timing of certificate grants
- The three years from 2023 to 2025 account for 5349 certificates, 51.1 per cent of the period's total. Of these, 74.2 per cent were filed in 2019 or earlier. The rise in issuance is largely the clearance of a backlog.
- The median interval between filing and grant is six years for farmers, seven for private firms, two for public institutions and one for State Agricultural Universities.
6.3. On farmer registration
- Rice accounts for 63.5 per cent of farmer certificates. Excluding rice, the farmer share of the register falls to 30.2 per cent and private applicants become the largest applicant category at 41.8 per cent. No other crop, removed in turn, moves any category's share by more than three percentage points.
- Farmer certificate holdings are themselves concentrated. Of 3269 farmer applicants, 84 per cent hold a single certificate. The twenty largest hold 18.5 per cent of farmer certificates. The largest holders are registering organisations and their holdings are almost entirely in rice.
6.4. On concentration among private firms
- The 3071 private certificates are held by 133 named applicants. The largest holds 22.2 per cent, the three largest 37.1 per cent and the five largest 48.4 per cent.
- After controlling for name changes and ownership, the register contains 103 groups and the five largest hold 56.1 per cent rather than 48.4 per cent. The Gini coefficient rises from 0.791 to 0.823.
- The share held by the five largest firms rose from 45.7 per cent in 2009-2012 to 54.8 per cent in 2013-2018 and fell to 48.5 per cent in 2019-2025. Each of the ten largest firms grew throughout. Of the sixty-nine firms new to the register in 2019-2025, thirty-nine had filed before 2019 and hold 85 per cent of that group's certificates.
6.5. On crop groups
- Private participation ranges from 84.2 per cent in fibre crops and 69.7 per cent in vegetables to 3.6 per cent in legumes and 0 per cent in spices. Within cotton, private certification is concentrated in tetraploid hybrids, which mostly carry the licensed Bt trait in India (90.4 per cent), while the re-sowable diploid species remain largely with State Agricultural Universities (54.8 per cent).
- Concentration is highest where participation is highest for each applicant category. The five largest firms hold 67.5 per cent of private certificates in fibre crops, 67.1 per cent in vegetables and 50.9 per cent in cereals.
6.6. On the Act's redistributive provisions
The National Gene Fund recorded no disbursement other than administrative expenditure in any year from 2012-13 to 2024-25. In 2015-16 its total expenditure was ?630 against a closing balance of ?6.91 crore. No benefit-sharing amount has been determined or paid, as per the Authority's annual reports. The reports over the same period describe compulsory licensing solely as a statutory provision and record no application or order for the same.
7. Conclusion
In aggregate the Act appears unusually successful, as farmers hold half the certificates issued under it, a result without parallel among intellectual property protection regimes. The categories in which those certificates are held qualify the result. Farmers hold rights over farmers' varieties, a category defined by prior cultivation. Private firms hold rights over new varieties and varieties of common knowledge. Two-thirds of their certificates are for rice. Excluding rice, private firms become the largest category of right-holders. The headline achievement on farmers' rights is, to a considerable extent, an achievement in one crop and it is a facilitated achievement, as a small number of registering organisations and State programmes account for the bulk of it, with a long tail of farmers who registered only one variety.
The Act's redistributive provisions, which were to convert recognition into economic return, have not operated satisfactorily. The Authority's accounts show the National Gene Fund taking in contributions, fees and interest every year since 2012-13 and paying out only for administration, with its expenditure in 2015-16 amounting to ?630 against a corpus that had reached ?6.91 crore. By March 2025, its deposits exceeded ?51 crore, according to its reports. No benefit-sharing claim has been determined in that period and as late as 2018-19, the Authority was still resolving which institutions would determine such claims (Protection of Plant Varieties and Farmers' Rights Authority, 2019). Compulsory licensing appears in every annual report only in name and not as a proceeding. The one channel that has operated is the Plant Genome Saviour award, a recognition prize capped at ?85 lakh per year, which by 2023 had conferred 35 community awards and 131 individual awards and recognitions. Peschard (2014), writing on the Fund's first few years, found that benefit-sharing in commercialisation had not been implemented and that the Fund's only operative disbursement was this recognition award to a small number of farming communities each year. This paper finds the structure unchanged over a decade later.
Private participation is concentrated in cotton, vegetables and a small number of hybrid crops and is nearly absent from legumes, fruits and spices. Among private firms, concentration has moved in both directions, rising through the register's middle years and easing in the most recent period, but the easing reflects the arrival at grant of long-pending applications rather than new entry and once the register is resolved to controlling ownership, the five largest groups hold 56 per cent of private certificates. This differs from the United States, where three firms held 58 per cent of plant variety protection certificates issued between 2001 and 2021 (MacDonald et al., 2023), a concentration that Howard (2015) traces to the entry of agrochemical corporations into the seed sector through acquisition, reinforced by successive expansions of intellectual property protection.
Three recommendations follow. First, the Authority should publish the fields that its own Rules require it to record, in particular, expiry, revocation and licensing, so that the register shows which rights are in force. Second, the benefit-sharing and compulsory-licensing provisions should either be operationalised, beginning with the question of beneficiary determination that the Authority has discussed since 2018-19, or be acknowledged as inoperative, with the Gene Fund's accumulating corpus redirected to the conservation purposes that section 45 already permits. Third, farmer registration should be treated as the facilitated, campaign-driven activity that the record shows it to be. A system that relies heavily on the intermittent initiative of isolated intermediaries will produce uneven registration across crops, states and over time. If registration is to serve its goal towards benefiting farmers, it requires sustained institutional support.
REFERENCES
Bala Ravi, S. (2004). Manual on farmers' rights. M. S. Swaminathan Research Foundation.
Cotton Seeds Price (Control) Order, 2015, Gazette of India, Part II, Section 3 (2015).
Dhar, B. (2002). Sui generis systems for plant variety protection: Options under TRIPS. Quaker United Nations Office. https://quno.org/resource/2002/4/sui-generis-systems-plant-variety-protection
Gopalakrishnan, N. S. (2002). Protection of traditional knowledge: The need for a sui generis law in India. The Journal of World Intellectual Property, 5(5), 725–742. https://doi.org/10.1111/ j.1747-1796.2002.tb00179.x
Hanchinal, R. R., Agrawal, R. C., Prakash, R., Stephen, T., & Jaiswal, J. (2014). Impact of awareness programmes and capacity building in farmers' plant variety registration under the PPV&FR Act. Journal of Intellectual Property Rights, 19, 347–352.
Howard, P. H. (2015). Intellectual property and consolidation in the seed industry. Crop Science, 55(6), 2489–2495. https://doi.org/ 10.2135/cropsci2014.09.0669
Kochupillai, M. (2016). Promoting sustainable innovations in plant varieties (Munich Studies on Innovation and Competition 5). Springer. https://doi.org/10.1007/978-3-662-52796-2
Lushington, K. (2012). The registration of plant varieties by farmers in India: A status report. Review of Agrarian Studies, 2(1), 112–128. https://doi.org/10.25003/ras.02.01.0005
MacDonald, J. M., Dong, X., & Fuglie, K. O. (2023). Concentration and competition in U.S. agribusiness (Economic Information Bulletin No. 256). United States Department of Agriculture, Economic Research Service. https://doi.org/10.32747/2023.8054022.ers
Peschard, K. (2014). Farmers' rights and food sovereignty: Critical insights from India. The Journal of Peasant Studies, 41(6), 1085–1108. https://doi.org/10.1080/03066150.2014.937338
Pray, C. E., & Ramaswami, B. (2001). Liberalisation's impact on the Indian seed industry: Competition, research and impact on farmers. International Food and Agribusiness Management Review, 2(3–4), 407–420. https://doi.org/10.1016/S1096-7508(01)00038-6
Protection of Plant Varieties and Farmers' Rights Act, No. 53 of 2001, India Code (2001).
Protection of Plant Varieties and Farmers' Rights Authority. (2013–2025). Annual reports 2012-13 to 2024-25. Government of India. Https://plantauthority.gov.in/ annual-report
Protection of Plant Varieties and Farmers' Rights Rules, 2003, Gazette of India, Extraordinary, Part II, Section 3(i) (2003).
Sahai, S. (2003). India's Plant Variety Protection and Farmers' Rights Act, 2001. Current Science, 84(3), 407–412. https://www.jstor.org/stable/24107424
Salazar, R., Louwaars, N. P., & Visser, B. (2007). Protecting farmers' new varieties: New approaches to rights on collective innovations in plant genetic resources. World Development, 35(9), 1515–1528. https://doi.org/10.1016/j.worlddev.2006.05.019
Singh, R. P., & Agrawal, R. C. (2019). Farmers' varieties in India: Factors affecting their preferential prevalence and the current status of their legal protection. Indian Journal of Agricultural Sciences, 89(9), 1371–1382.
Subash, A. (2026). Who owns India's plant varieties? PVP Certification Explorer (India) (Version 0.2.1). Zenodo. https://doi.org/10.5281/zenodo.21370360
United Nations Environment Programme. (2020, February 18). An Indian farming biodiversity success story. https://www.unep.org/news-and-stories/story/indian-farming-biodiversity-success-story
About Authors
Ambika Subash is a Senior Research Fellow and Ph.D. scholar at the Centre for Economic Studies and Planning, School of Social Sciences, Jawaharlal Nehru University, New Delhi. Her academic engagement is centered on research in economics and related areas of social sciences.
This article, originally published in the Indian Journal of Socio-Economic Studies (IJSES), Volume I, Issue No 3, is reproduced in Socio-Economic Voices on Indiastat in recognition of its continuing relevance to the Public Science, Private Capital, Farmers' Varieties: An Analysis of Certification under India's Plant Variety Protection Regime (2009-2025), as well as its contribution to evidence-based research and public policy
Disclaimer : The opinions expressed in this article are the personal opinions of the author. The facts and opinions appearing in the article do not reflect the views of Indiastat and Indiastat does not assume any responsibility or liability for the same.
indiastat.comNovember, 2026
socio-economic voices